Use a Chart to place graphical report in a window.
Open the destination window to add the Control.
From the Toolbox, select the Control icon, move the pointer into the window and drag out the initial position and size for the control.
If the Property Editor is not displayed, click on Ribbon > Home > Property Editor
Click on the Control. The Properties for the control will appear in the Property Editor panel and allow changes to be made.
Name: Name of the control
Alias: Alias of the control
General:
Template: Select a template from the defined templates to use for this control. See Templates.
Layout: Determines the layout parameters for the control
X: X location in the window to place the control
Y: Y location in the window to place the control
Width: Width of the control
Height: Height of the control
Anchor: Which edge of the window the control is anchored to when the window is resized. See Anchors.
Visual: The Visual category allows the user to configure the look and feel of the control.
Visible: Defaults to visible but untick if you wish this Control to be invisible
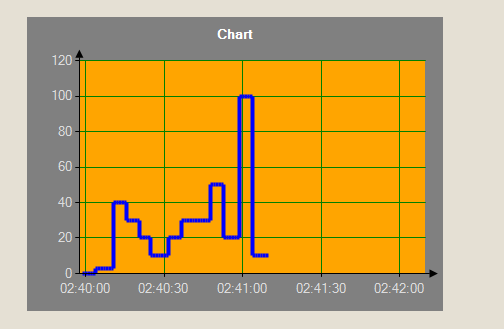
Title: Title of the chart.
Title Visible: Defaults to visible but untick if you wish this Title to be invisible.
Chart Type: Type of the graph, Line or Column
Back Color: Select the background color of chart.
Chart Back Color: Select the background color of chart graph.
Chart Line Color: Select the line color of chart graph.
Title Color: Select the title color of chart graph.
Stroke Color: Select the stroke color of chart graph.
Stroke Width: Set the width of stroke line.
Binding: The following properties of the Chart Control may be bound to a tag;
Value:
Visible: